Task #2130
closedcreate an attractive infographic showing how donations are used
0%
Description
We have some text on the donate page showing what we use the money for, but maybe we could showcase this more effectively with an infographic. It wouldn't have to be very detailed on numbers, but highlight some of the things we do (infrastructure, LibOCon, community budgets, team etc.) Alternatively, it could highlight some achievements from the previous year that were made possible thanks to donations. Some inspiration:
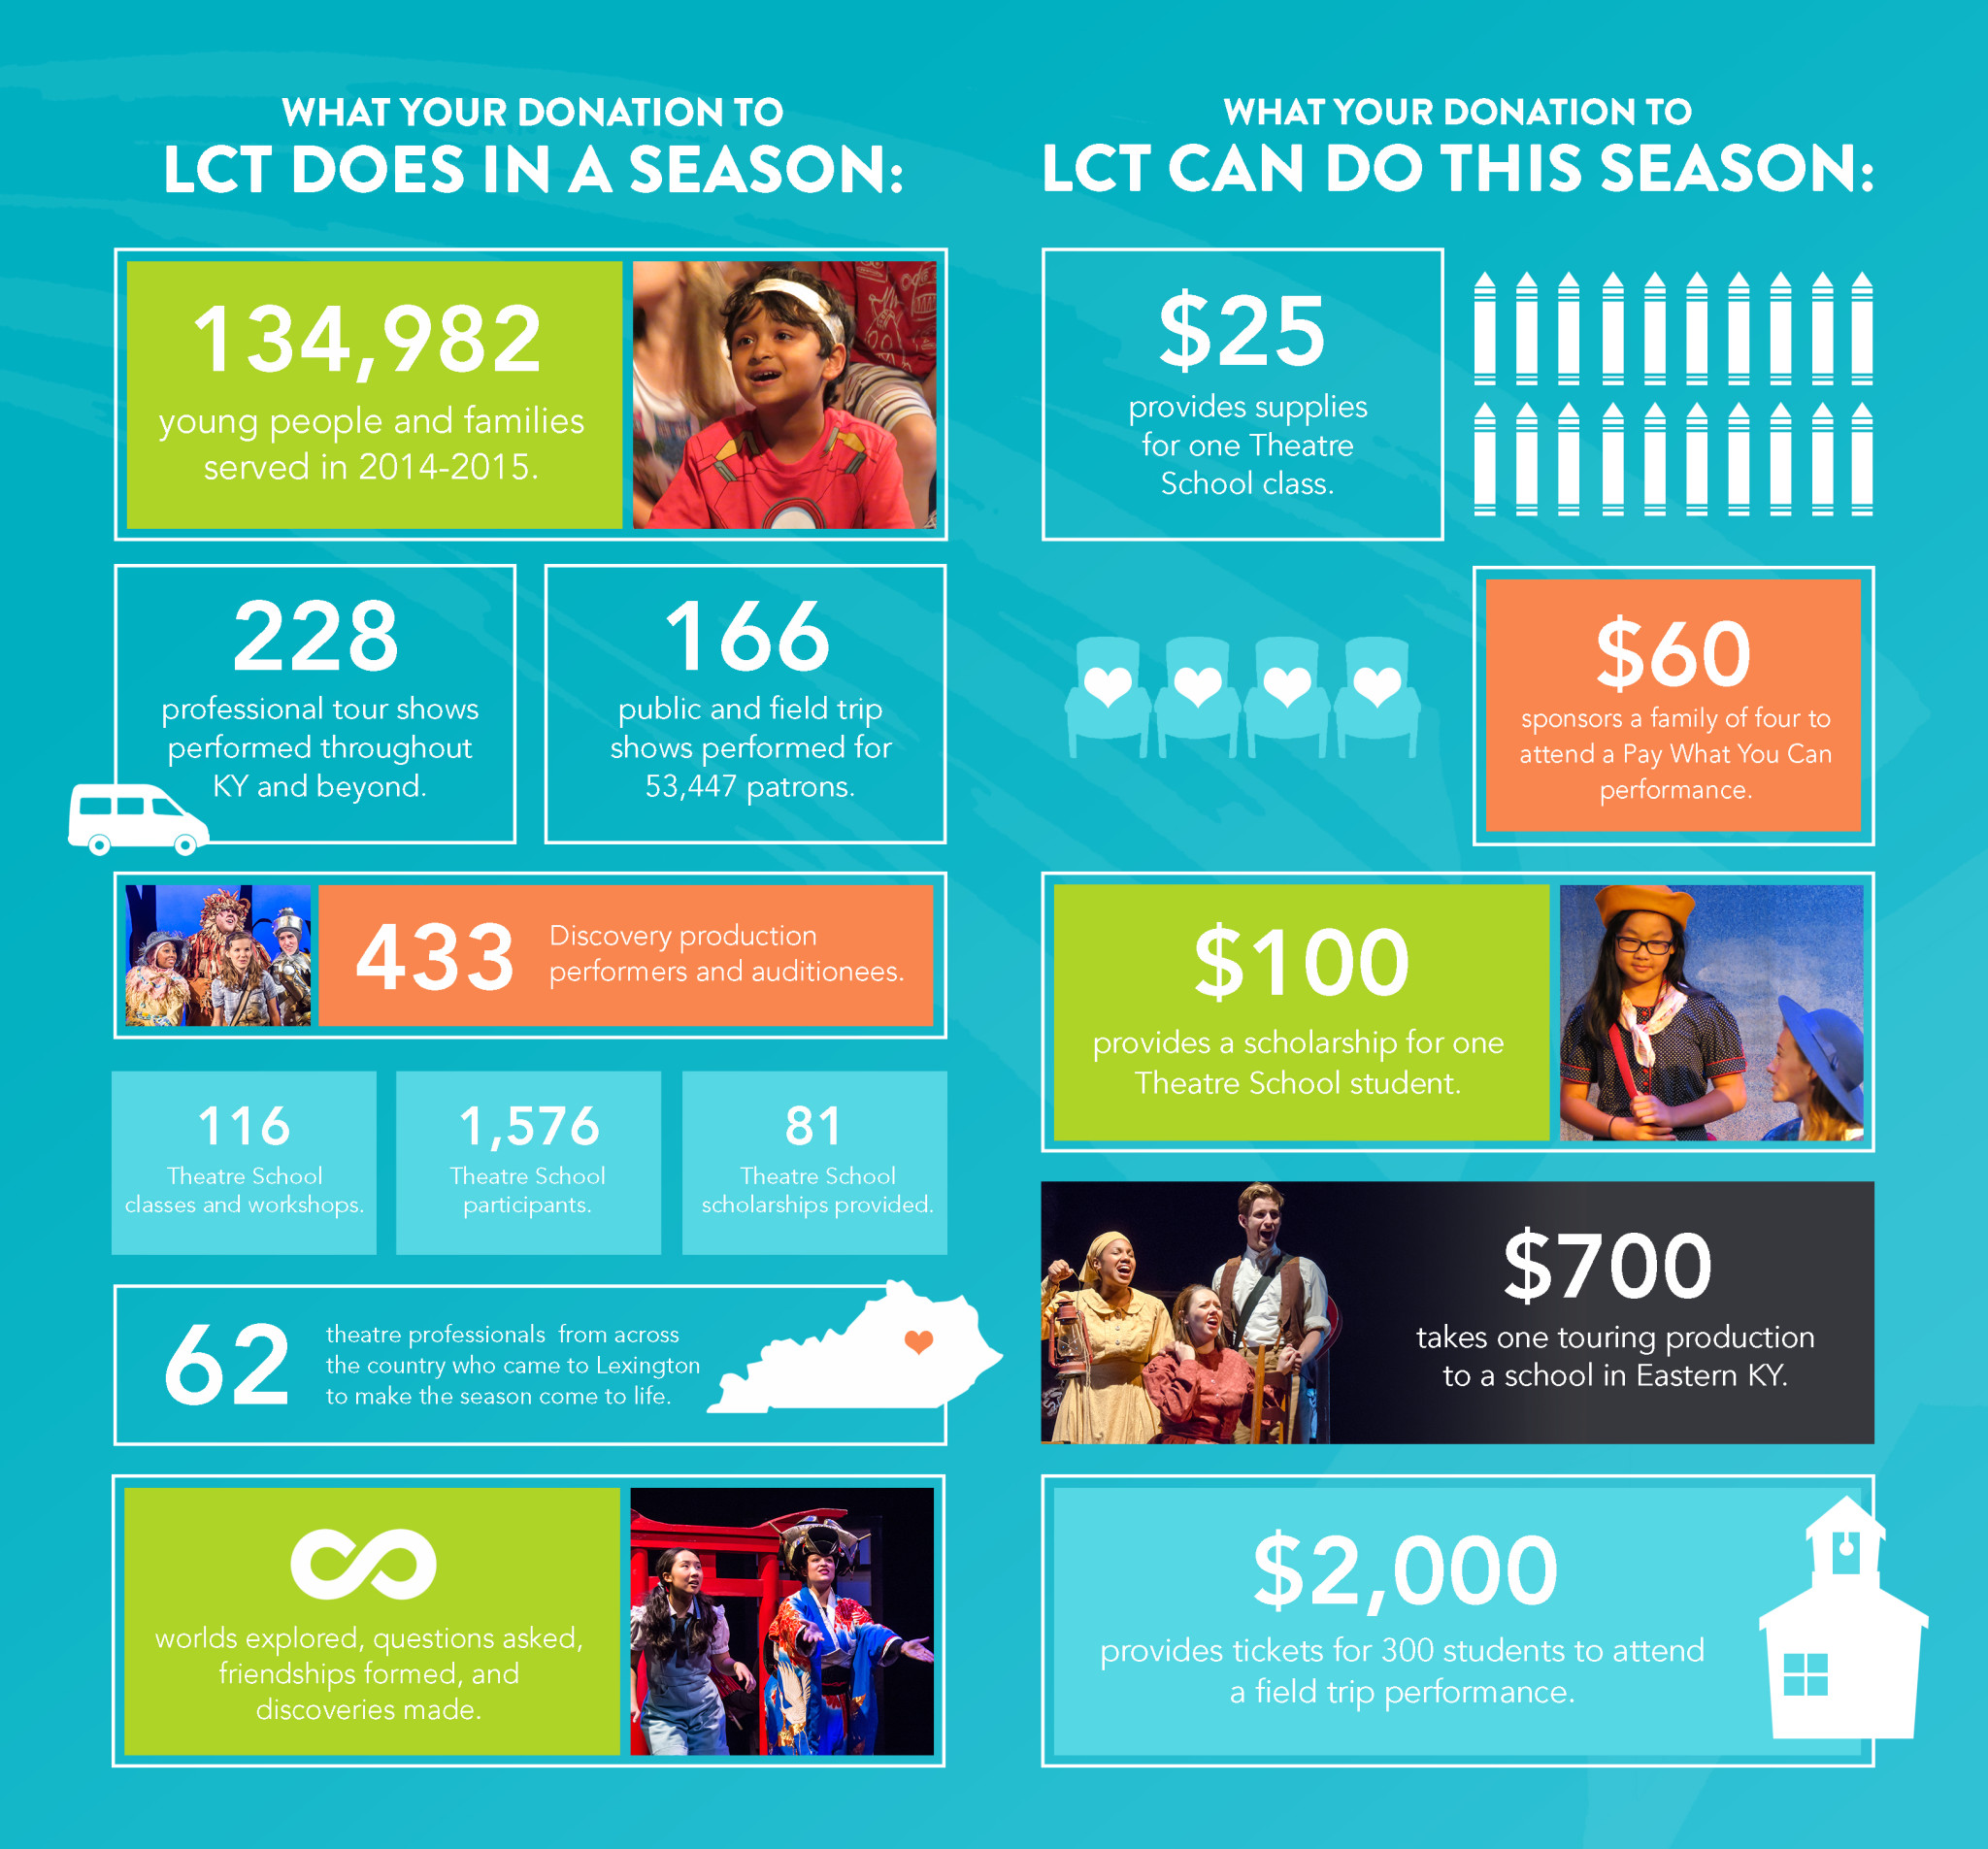
- http://www.lctonstage.org/wp-content/uploads/1970/01/Donation-Infographic1.jpg
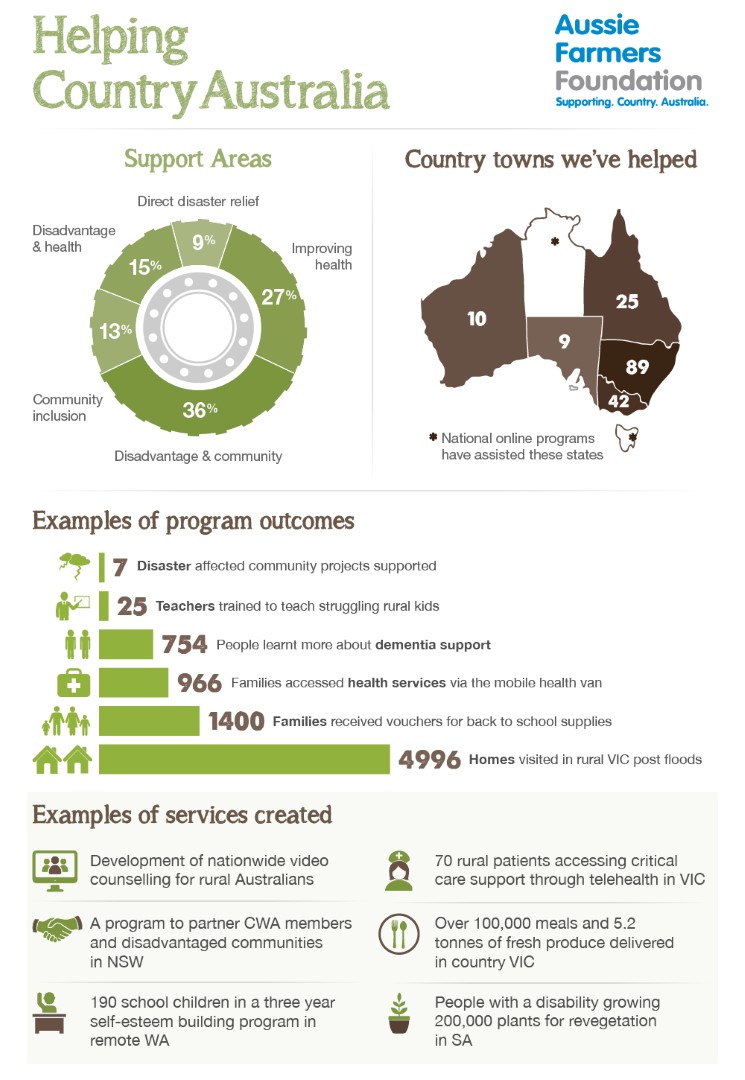
- https://aussiefarmersdirect.files.wordpress.com/2014/05/supporting-country-australia-infographic-home-large.jpg
- http://blog.worldvision.org/sites/default/files/wp-content/uploads/2013/07/Infographic-Week12-FINAL.jpg
- https://www.einstein.yu.edu/uploadedImages/centers/cancer/support/BOLD_Annual_Drive/how-your-donations-will-help-infographic.gif
Setting this as Q2/2017 as it's something I could work on after my graphic design training in April.
Files
Related issues
 Updated by Florian Effenberger almost 7 years ago
- Related to Task #2204: annual report 2016 design added
Updated by Florian Effenberger almost 7 years ago
That IMHO is something that ideally would fit into the printed annual report, what do you think?
Updated by Florian Effenberger almost 7 years ago
The annual report draft at p. 8 has something like that - is that what you had in mind?
Updated by Florian Effenberger almost 7 years ago
Florian Effenberger wrote:
The annual report draft at p. 8 has something like that - is that what you had in mind?
Ping? :)
Updated by Mike Saunders almost 7 years ago
- Target version changed from Q2/2017 to Q3/2017
Florian Effenberger wrote:
Florian Effenberger wrote:
The annual report draft at p. 8 has something like that - is that what you had in mind?
Ping? :)
Sorry for the delayed response to this! The Annual Report has a pie chart giving a broad overview of how donations are spent, but I'm thinking of something with more detail, really encouraging people to donate by showing the benefits, like this:
http://www.lctonstage.org/wp-content/uploads/1970/01/Donation-Infographic1.jpg
So we could have something like:
"Last year your donations helped us...
- Expand our infrastructure for better reliability/security/whatever
- Hire a dedicated QA engineer to work on bug reports
- Coordinate three hackfests in X, Y and Z, to bring developers together
- Travel to X and Y to spread the word about open source and open standards
- Organise a conference in Brno with over 100 attendees"
With lots of pictures, and then a call to action to donate at the end. How does that sound?
Bumping to Q3, but I'll have proper time to work on this as soon as the 5.4 release is done.
Updated by Florian Effenberger almost 7 years ago
With lots of pictures, and then a call to action to donate at the end.
How does that sound?Bumping to Q3, but I'll have proper time to work on this as soon as the
5.4 release is done.
Sounds great!
Updated by Mike Saunders over 6 years ago
Done the initial wording -- now working on the layout:
Support LibreOffice!
LAST YEAR YOUR DONATIONS HELPED US TO...
- Employ a small team working on release building, documentation, marketing, design and administration
- Expand our infrastructure with new file-sharing, survey hosting and education software services
- Hire a dedicated quality assurance (QA) engineer to handle bug reports
- Coordinate three hackfests in Brussels, Ankara and Turin, to bring developers together
- Fund tenders for new features including a crash reporter and profile safe mode
- Organise the LibreOffice conference in Brno, with over 100 attendees from around the world
...and there's so much more we can do! Donate today, and together we can make LibreOffice even better:
www.libreoffice.org/donate/ [QR CODE]
Updated by Mike Saunders over 6 years ago
Draft posted on the private marketing list for feedback.
Updated by Mike Saunders over 6 years ago
- File LO_donate_infographic.pdf added
- Status changed from New to In Progress
Updated version attached, following feedback. If there are no other objections, we can start to use this in donation drives.
Updated by Mike Saunders over 6 years ago
- File deleted (
LO_donate_infographic.sla)
Updated by Mike Saunders over 6 years ago
- File deleted (
LO_donate_infographic.pdf)
Updated by Mike Saunders over 6 years ago
- File LO_donate_infographic.pdf LO_donate_infographic.pdf added
- File LO_donate_infographic.sla LO_donate_infographic.sla added
- File LO_donate_single_conference.pdf LO_donate_single_conference.pdf added
- File LO_donate_single_hackfests.pdf LO_donate_single_hackfests.pdf added
- File LO_donate_single_infra.pdf LO_donate_single_infra.pdf added
- File LO_donate_single_qa.pdf LO_donate_single_qa.pdf added
- File LO_donate_single_team.pdf LO_donate_single_team.pdf added
- File LO_donate_single_tenders.pdf LO_donate_single_tenders.pdf added
Adding updated Scribus file (with embedded images) plus PDFs of individual squares.
Note that these are not to be distributed until we have bought the icons from Noun project.
Updated by Mike Saunders over 6 years ago
- Status changed from In Progress to Closed
Icons were bought, infographic finished, and promoted, eg: https://twitter.com/libreoffice/status/907226016137011200
Also, an ODG version has been shared with the l10n community for their own translations. So this is done now -- closing the ticket.