Actions
Task #2130
closedcreate an attractive infographic showing how donations are used
Start date:
Due date:
% Done:
0%
Description
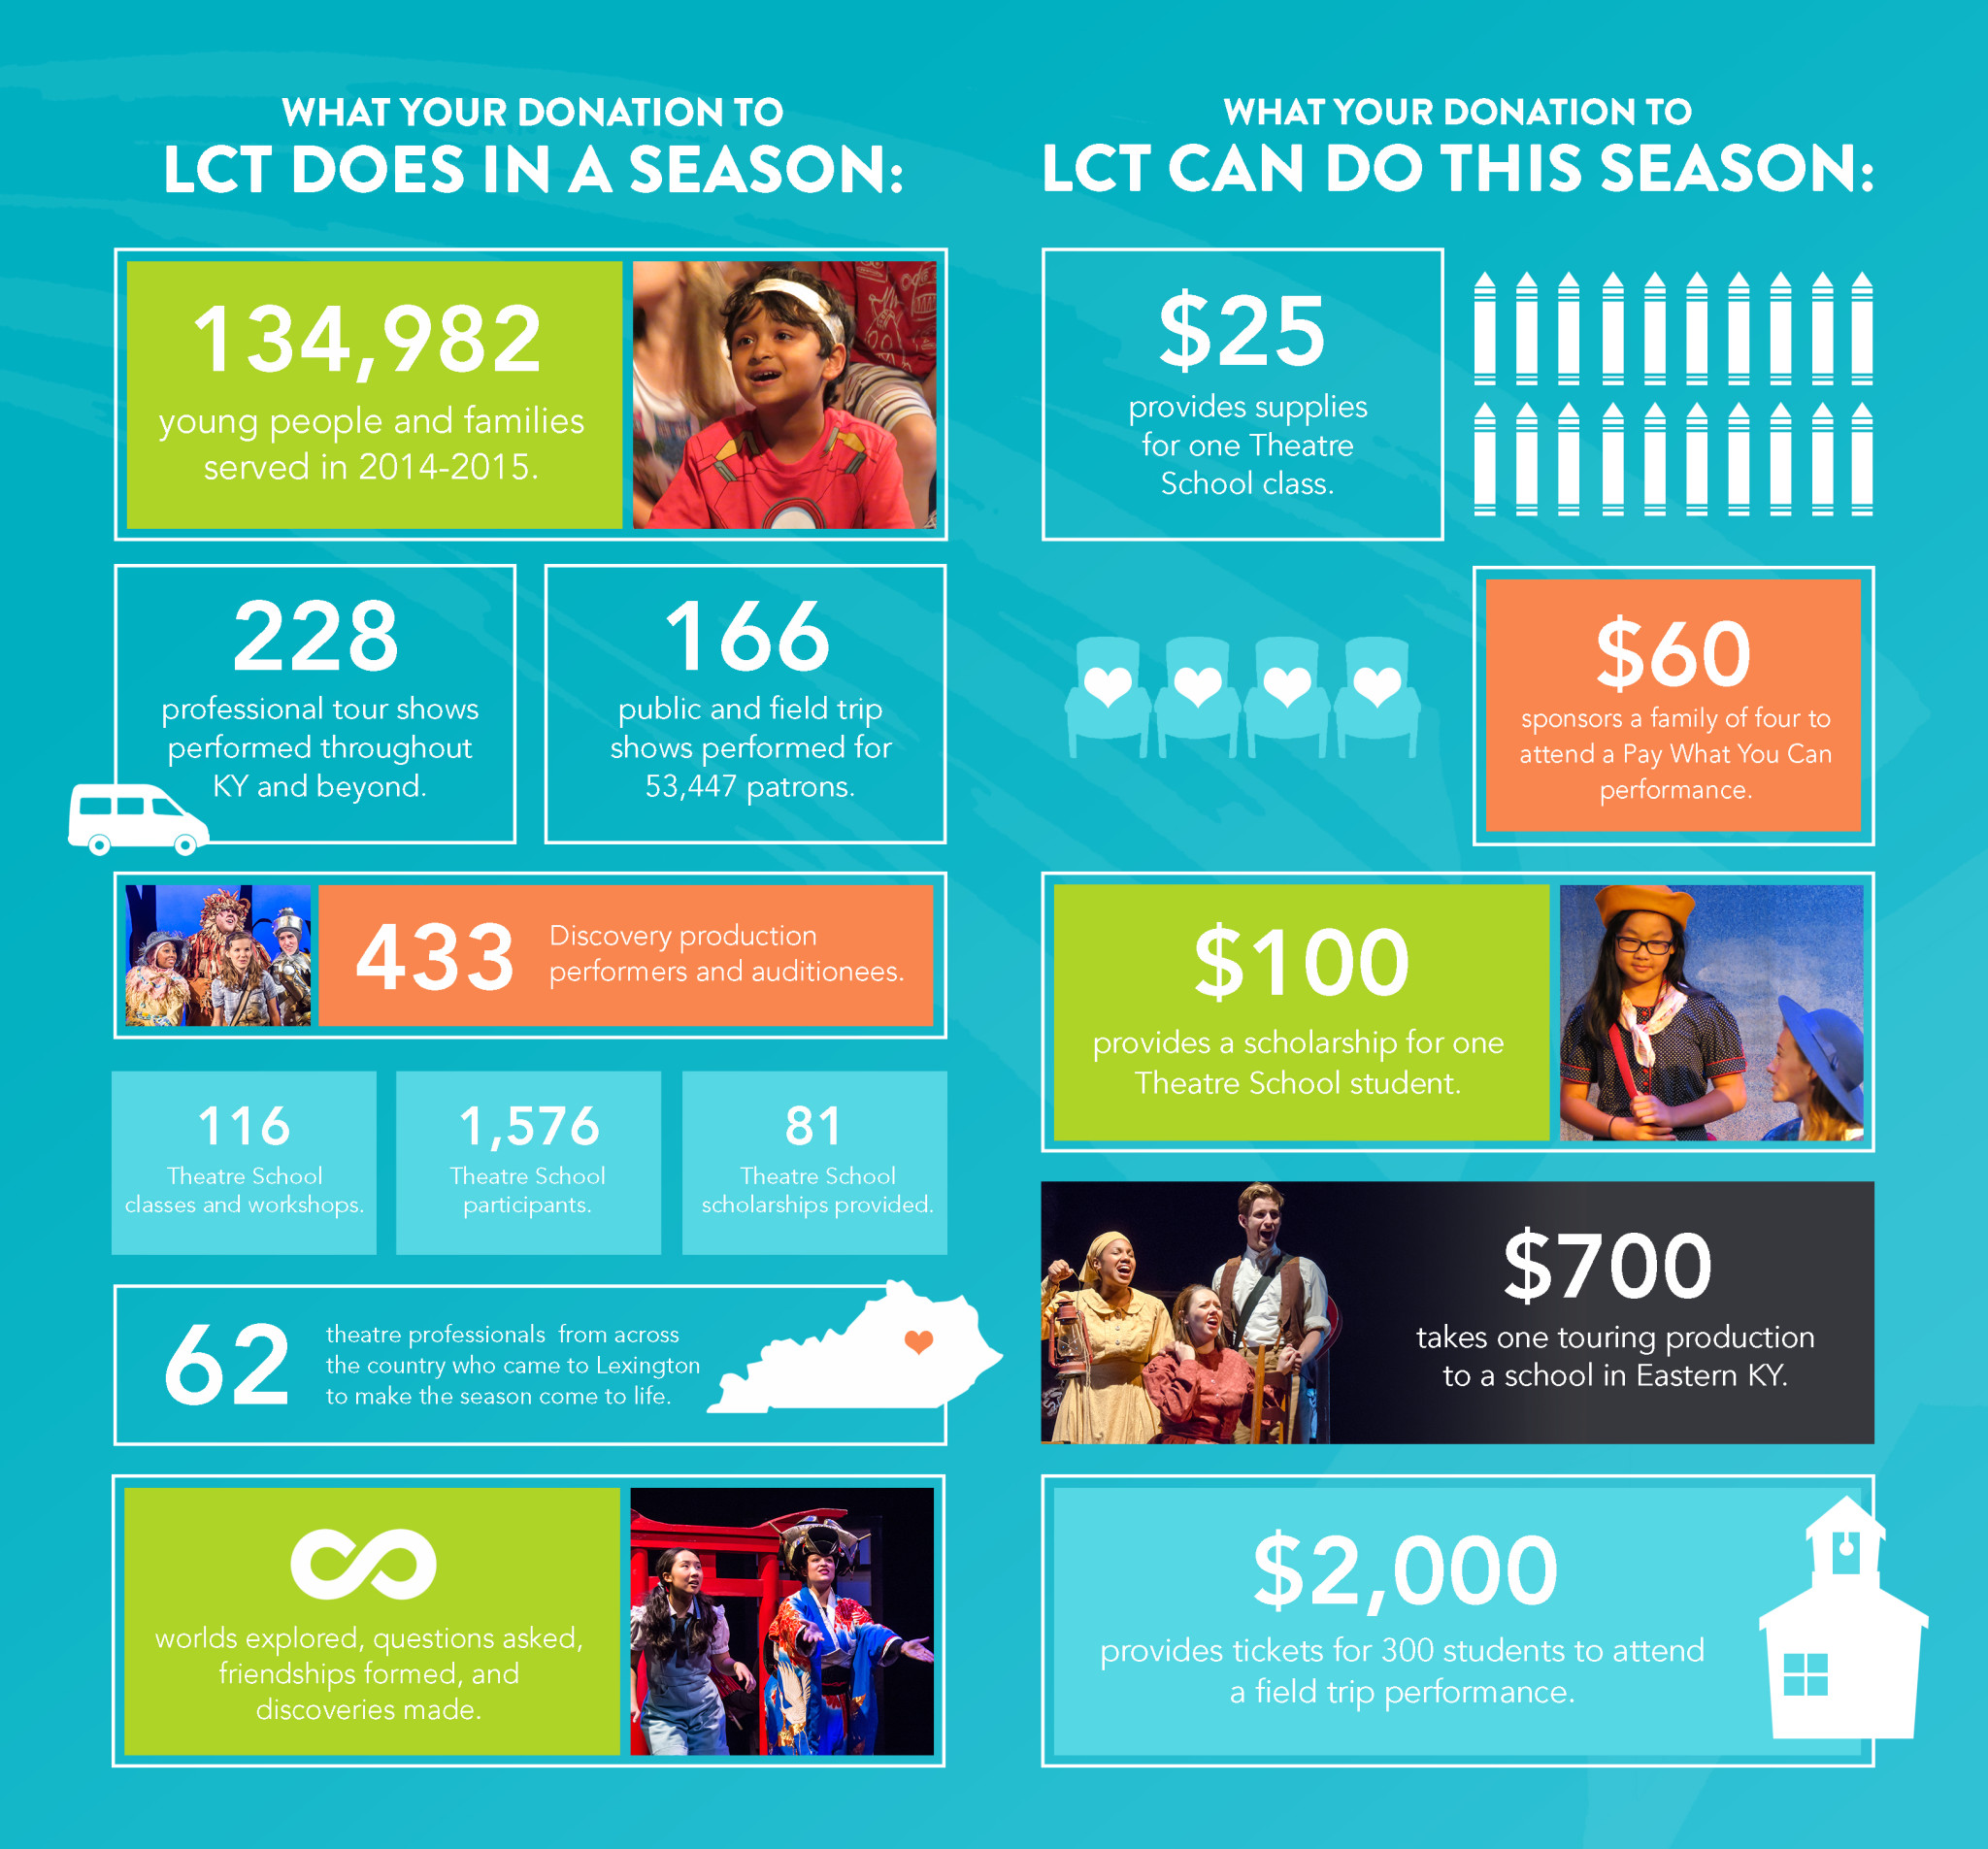
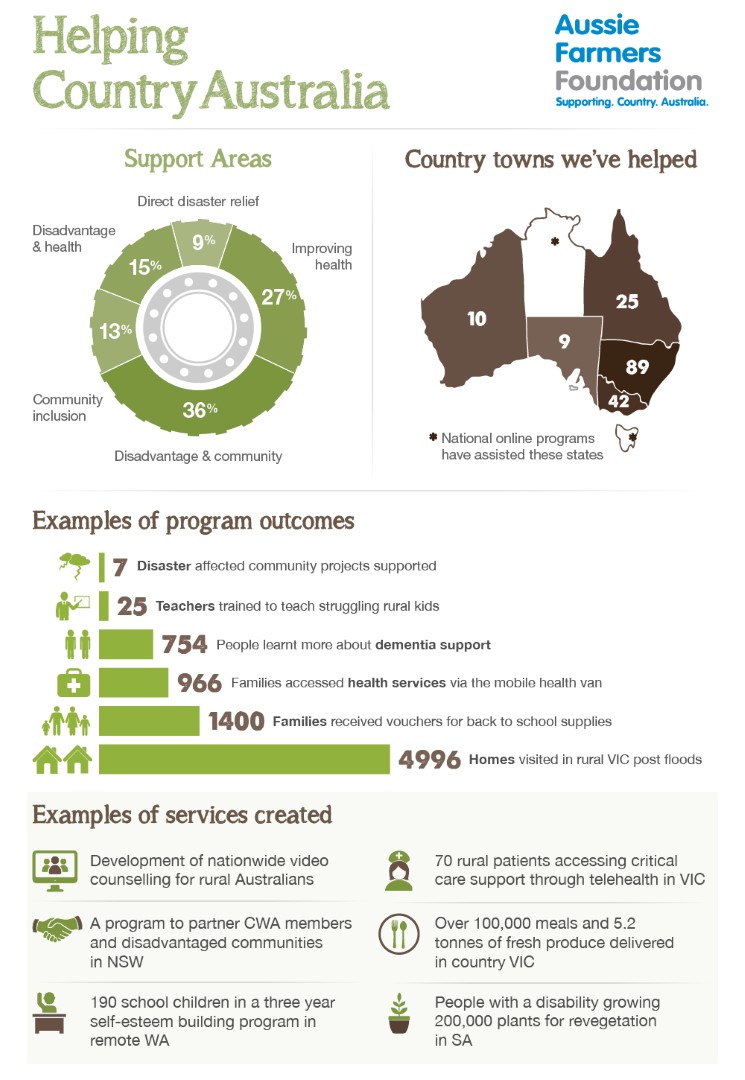
We have some text on the donate page showing what we use the money for, but maybe we could showcase this more effectively with an infographic. It wouldn't have to be very detailed on numbers, but highlight some of the things we do (infrastructure, LibOCon, community budgets, team etc.) Alternatively, it could highlight some achievements from the previous year that were made possible thanks to donations. Some inspiration:
- http://www.lctonstage.org/wp-content/uploads/1970/01/Donation-Infographic1.jpg
- https://aussiefarmersdirect.files.wordpress.com/2014/05/supporting-country-australia-infographic-home-large.jpg
- http://blog.worldvision.org/sites/default/files/wp-content/uploads/2013/07/Infographic-Week12-FINAL.jpg
- https://www.einstein.yu.edu/uploadedImages/centers/cancer/support/BOLD_Annual_Drive/how-your-donations-will-help-infographic.gif
Setting this as Q2/2017 as it's something I could work on after my graphic design training in April.
Files
Related issues
Actions